Local SEO for Multiple Locations: Every Branch Ranks Alone
Each branch competes in its own catchment against its own rivals, so a portfolio average misleads. How multi-location visibility diverges, and how to see it.

SummaryA chain isn't one ranking problem repeated. Identical execution produces a different map at every branch, and a dashboard average hides it. How to see per-location visibility as it really is.
Read moreShow less
Why One Strategy Fails, in Short
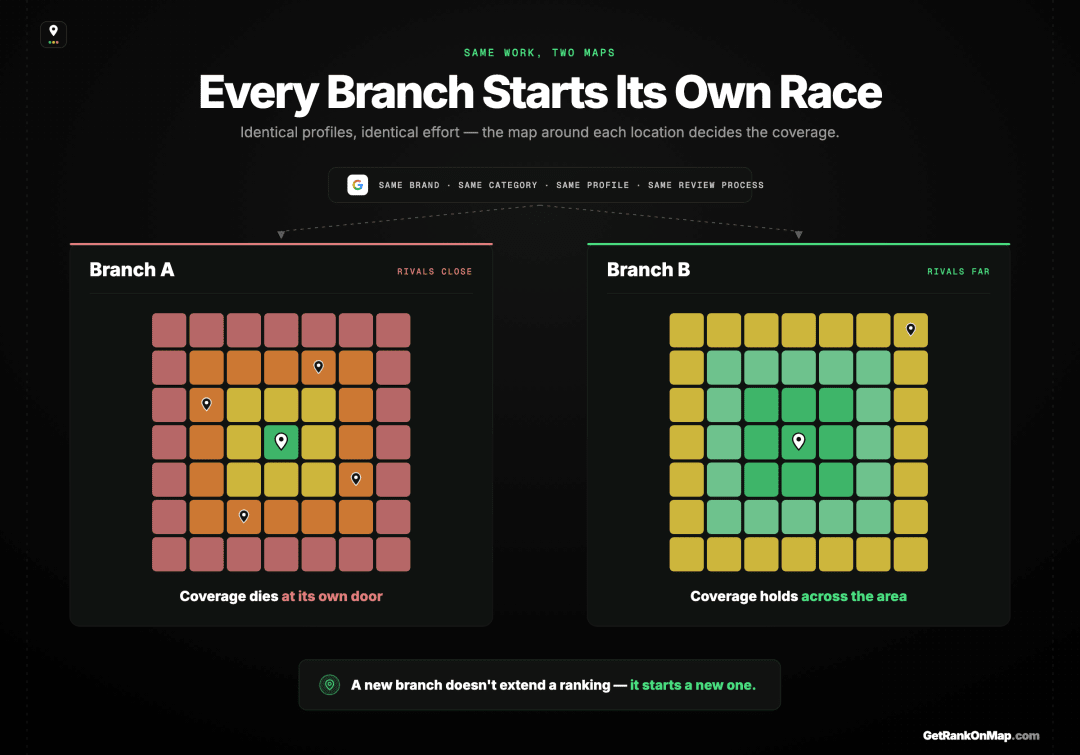
- A multi-location business isn't one ranking problem repeated — it's several genuinely different problems that happen to share a brand name, a playbook, and a reporting dashboard
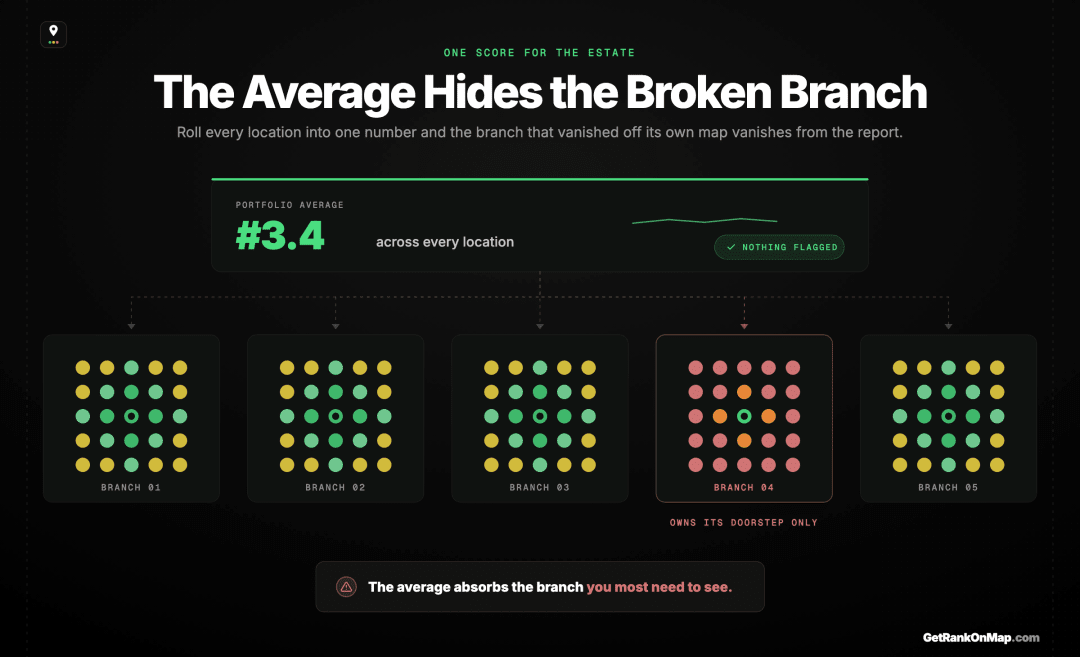
**Each location has its own [reach](https://getrankonmap.com/blog/how-far-does-my-google-maps-ranking-reach)** — the same brand, the same optimisation work and the same profile quality will carry a long way in one neighbourhood and barely past the door in another * **The difference is what surrounds each branch, not what you did to it** — Google ranks local results on [relevance, distance and prominence](https://support.google.com/business/answer/7091?hl=en), and two of those three are set by the map around the location rather than by your work on it * **Averaging across locations hides exactly the thing you need to see** — a healthy portfolio average routinely conceals one branch that's invisible three streets from its own door * **Your locations can compete with each other** — where catchments overlap, Google picks one of your branches for a given searcher, and it may not be the one you'd choose * **The only honest unit of measurement is the individual location, mapped** — a [GeoGrid](https://getrankonmap.com/blog/what-is-geogrid-rank-tracking) per branch, not a portfolio number Most advice about multi-location local SEO treats it as a scaling problem. Build the playbook once, roll it out across every branch, manage it from one dashboard, and the results follow. It's a tidy model, and it's the reason so many chains end up with a portfolio that looks fine in aggregate while individual locations quietly fail. Because the assumption underneath the scaling model — that your locations are the same problem in different postcodes — isn't true. They aren't the same problem. They just look the same in the report. ## Every Location Is Its Own Ranking Problem

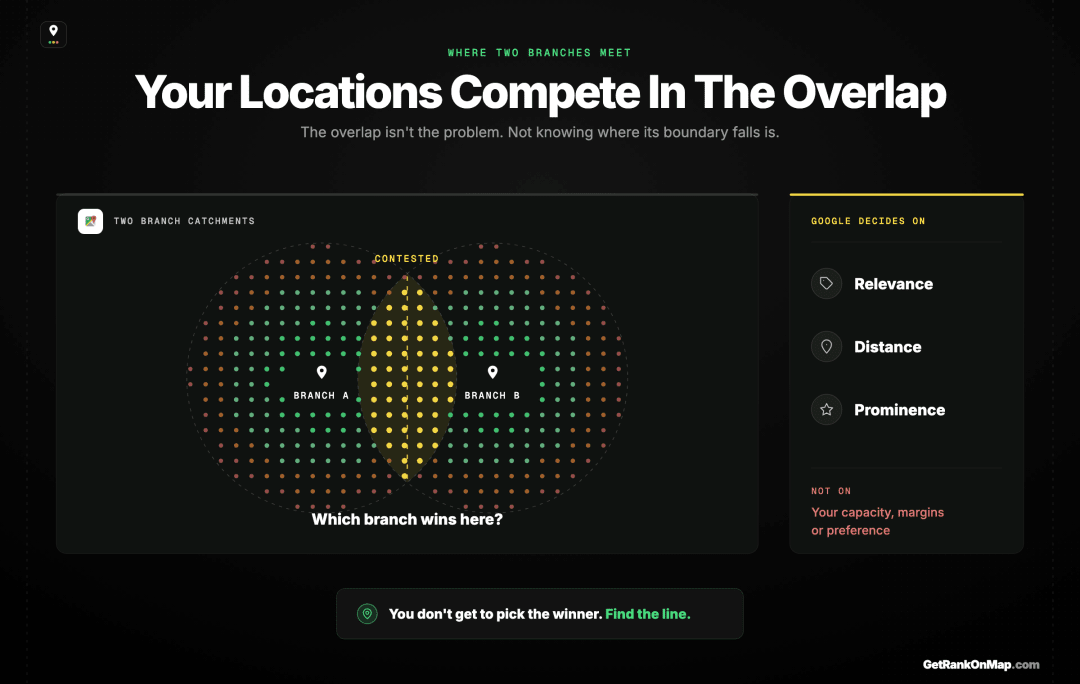
If two locations sit close enough that their catchments overlap, then for any searcher in the overlap, Google has to choose. It will pick whichever profile it judges most relevant and prominent for that searcher at that distance. It has no notion of your commercial preference — that one branch has more capacity, better margins, or is the one you'd rather send that customer to.
The result is a set of questions a portfolio average can never answer. Which of your branches actually wins the overlap? Is the boundary between them where you assumed it was? Are you fielding two profiles in a contested area where one strong one would serve you better? Is a new branch you opened quietly taking visibility from an established one nearby rather than adding to your total?
Note this cuts both ways. Overlap isn't automatically bad — covering an area from two directions can be exactly right. The problem is not knowing where the boundary falls, because then you're making network decisions, site decisions and budget decisions on an assumed map rather than the real one.
How to Audit a Multi-Location Footprint
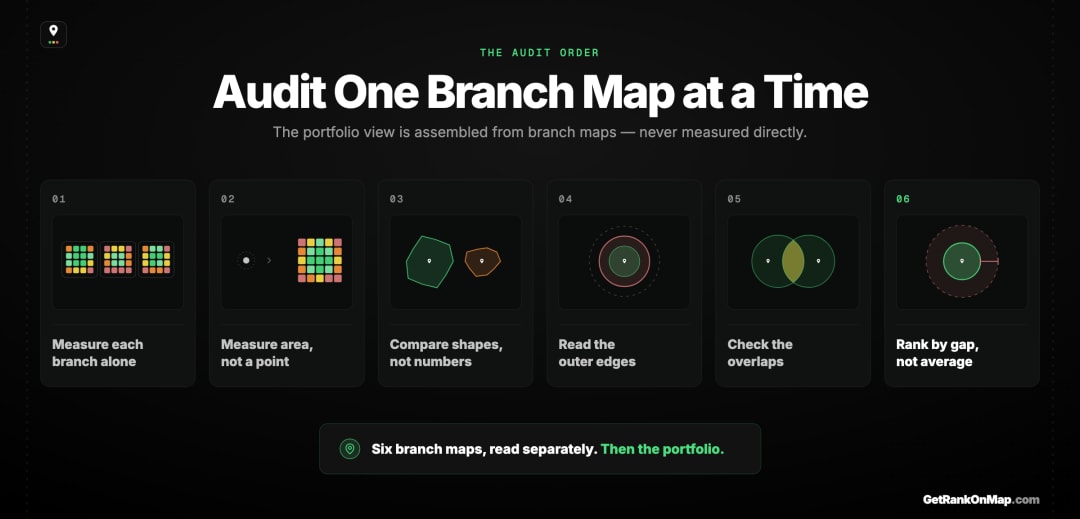
Measure per location, in space, and resist rolling up. The unit of truth is one branch's map — the portfolio view is something you assemble from those, not something you measure directly.
The method follows from everything above.
Measure each location separately. Not as a row in a portfolio table, but as its own case with its own result. The whole point is the variation between them, and any step that averages destroys it.
Measure across space, not at a point. Checking one search from one spot tells you about that spot. What you need to know is how far each branch's visibility extends and where it stops — which is a question about area, and needs a map to answer.
Compare the maps, not the numbers. Put branches side by side as shapes. The reads that matter are visible instantly and invisible in a table: this one is strong in a tight core and fades fast, that one carries much further, these two overlap here.
Look at the edges. The edge of each branch's reach is where you're losing searches you could plausibly win. It's also where you find out whether your assumed catchment matches the real one — usually it doesn't, and usually the real one is smaller.
Check the overlaps deliberately. Where two branches' areas meet, establish which one is actually winning and whether that's the outcome you want.
Then prioritise by gap, not by average. The branch that most deserves attention is rarely the one with the worst average. It's the one with the biggest gap between the area it should own and the area it actually holds.
Every Branch Is Its Own Race
The scaling model of multi-location local SEO isn't wrong about the work — the playbook really should be consistent, and the per-profile fundamentals really do repeat. It's wrong about the results. Consistent work does not produce consistent visibility, because visibility is set as much by what surrounds each branch as by what you do to it.
Which means the portfolio view most chains manage from — one average, one score, one line on a dashboard — is measuring the wrong thing at the wrong resolution. It's built by flattening exactly the variation that should be driving your decisions: which branch is underperforming its area, where each one's reach actually ends, and where your own locations are quietly taking searches from each other.
The fix isn't more reporting. It's a change of unit. Measure one location at a time, across the area it's meant to serve, as a map — then assemble the portfolio view from those, rather than starting there. The variation you've been averaging away is the entire signal.
RankMap is being built to do exactly this: a per-location GeoGrid for every branch you run, so you can see each one's real reach and where they overlap, instead of a number that hides both. We're pre-launch — join the early-access waitlist and you'll be among the first to map your footprint properly.
Go deeper
Frequently asked questions
- 01Is multi-location local SEO just single-location SEO repeated?
- No, and treating it that way is the common failure. The per-profile work does repeat, but the outcome doesn't — each location sits in a different competitive environment, so identical work produces different results. A chain is several distinct ranking problems that share a playbook, not one problem at scale.
- 02Why do two of my locations rank so differently when I've done the same work at both?
- Almost always because of what surrounds them rather than what you did to them. Google weighs distance from the searcher and prominence relative to nearby alternatives, so a branch with more strong competitors nearby will hold a much smaller area than an identical branch in a thinner market.
- 03Should I report multi-location performance as an average?
- An average is fine for a headline, but it can't be the working view. Averaging is what conceals a single failing location inside an acceptable-looking portfolio, and the effect gets stronger the more locations you have. Keep the per-location maps as the operational report.
- 04Can my own locations compete with each other in local search?
- Yes, wherever their catchments overlap. Google picks one profile per searcher based on its own factors, not on which branch you'd prefer. That's not necessarily a problem, but it becomes one if you don't know where the boundary between them actually falls.
- 05How do I know if a new location is adding visibility or taking it from an existing branch?
- By mapping both before and after, and looking at the overlap area specifically. A new branch that expands your total covered area is adding; one that mainly wins searches your existing branch was already winning is redistributing. The aggregate number looks similar in both cases — the maps don't.
- 06What's the right way to track rankings across many locations?
- Per location, spatially, and without rolling the results up before you've looked at them. The mechanics of doing that across a portfolio are covered in our guide to [hyperlocal rank tracking for multiple locations](https://getrankonmap.com/blog/hyperlocal-rank-tracking-multiple-locations).
Explore with AI
Share this
Map your real rank across the city.
Free for the first 50 scans. No credit card.
Join the waitlist

