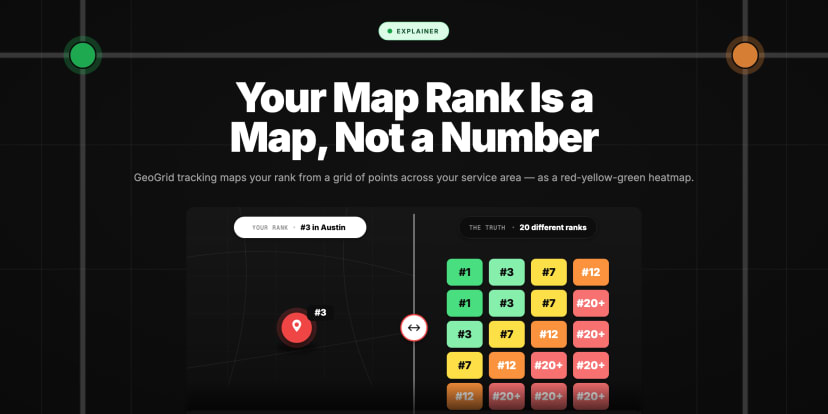
Hyperlocal Rank Tracker: One Heatmap Per Location
A hyperlocal rank tracker checks Map Pack position across each site's own catchment. Why a brand-level average hides the locations that are leaking.

Every Location, Its Own Map
-
Every location is its own hyperlocal contest — because distance is measured from the searcher, each of your sites competes in its own catchment against its own nearby rivals, with its own ranking
-
A brand-level rank number is a fiction at scale — "how are we ranking?" averaged across many locations hides the specific sites that are quietly invisible in their own area
-
The averages trap is where multi-location businesses lose money — strong flagship locations mask weak ones, so the group looks healthy while individual sites bleed customers unseen
-
One heatmap per location, not one number per brand — each site needs its own coverage map, read on its own ground, the way its own customers actually search
-
The job at scale is finding the outliers — across dozens or hundreds of locations, the value is in surfacing the handful of sites whose coverage has gone red while the rest stay green
-
This is a measurement problem before it's an SEO problem — you can't fix the underperforming location you can't see, and brand-level reporting is built to hide it
One location is a manageable question: where do we rank around here? Fifty locations is a different problem entirely — not fifty times harder, but a different kind of hard. Each site competes in its own neighbourhood, on its own terms, with its own ranking, so there is no single answer to "how are we doing." The danger isn't that multi-location tracking is laborious; it's that the easy summary — one brand-level number — is actively misleading, hiding the exact locations where you're losing. This piece is about why every site is its own contest, why averages betray you at scale, and how to track many locations without the weak ones disappearing.
Every Location Is Its Own Hyperlocal Contest
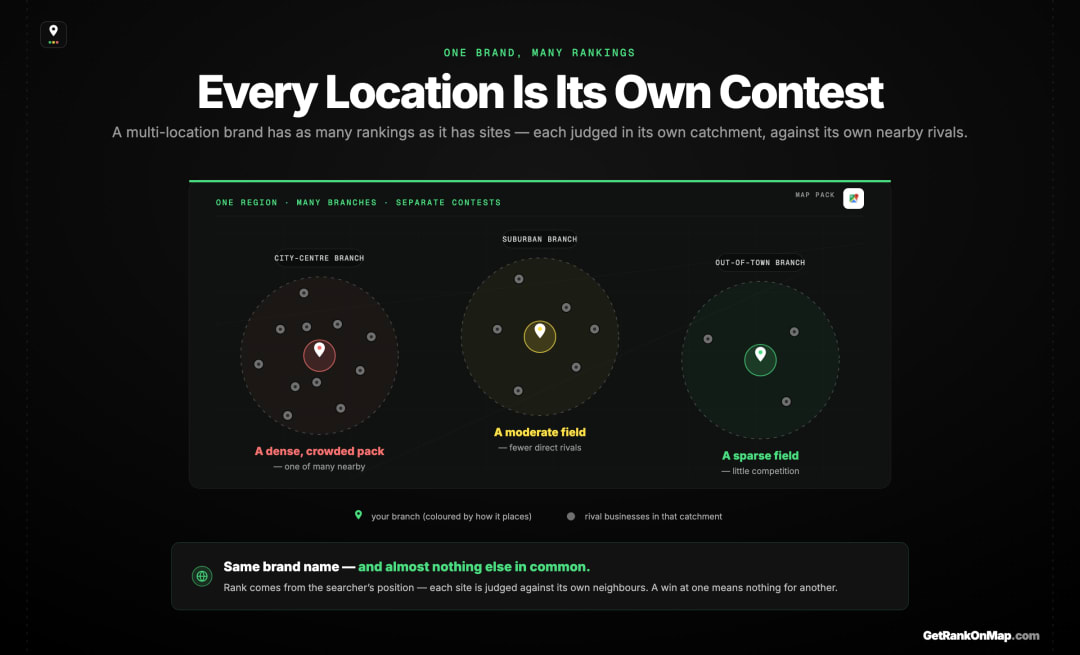
Because Google measures distance from each searcher, a location's ranking is anchored to its own address and its own neighbourhood of customers. Your downtown branch and your suburban branch aren't competing in the same race — they face different nearby rivals, in different catchments, and earn different rankings. Multi-location visibility is many separate contests, not one.
The single most important thing to grasp about multi-location local SEO is that you don't have a ranking — you have as many rankings as you have locations, and they're genuinely independent.
This follows directly from how local search works. Google names three inputs for local results — relevance, distance and prominence — and only one of them, distance, moves when the searcher does. Because Map Pack results are calculated from the searcher's position, each of your sites is judged in its own catchment, against whichever competitors happen to sit near that location. Your city-centre branch fights a dense, crowded pack; your out-of-town site fights a different, sparser one. They share your brand name and little else about their competitive reality. A win at one tells you nothing reliable about the other.
So the mental model "we're a strong brand, so we rank well" quietly breaks at scale. Brand strength helps, but each location still has to win its own local contest, and some will be winning while others are losing at the very same moment. Treating them as one thing is the first and most expensive mistake.
The Averages Trap at Scale
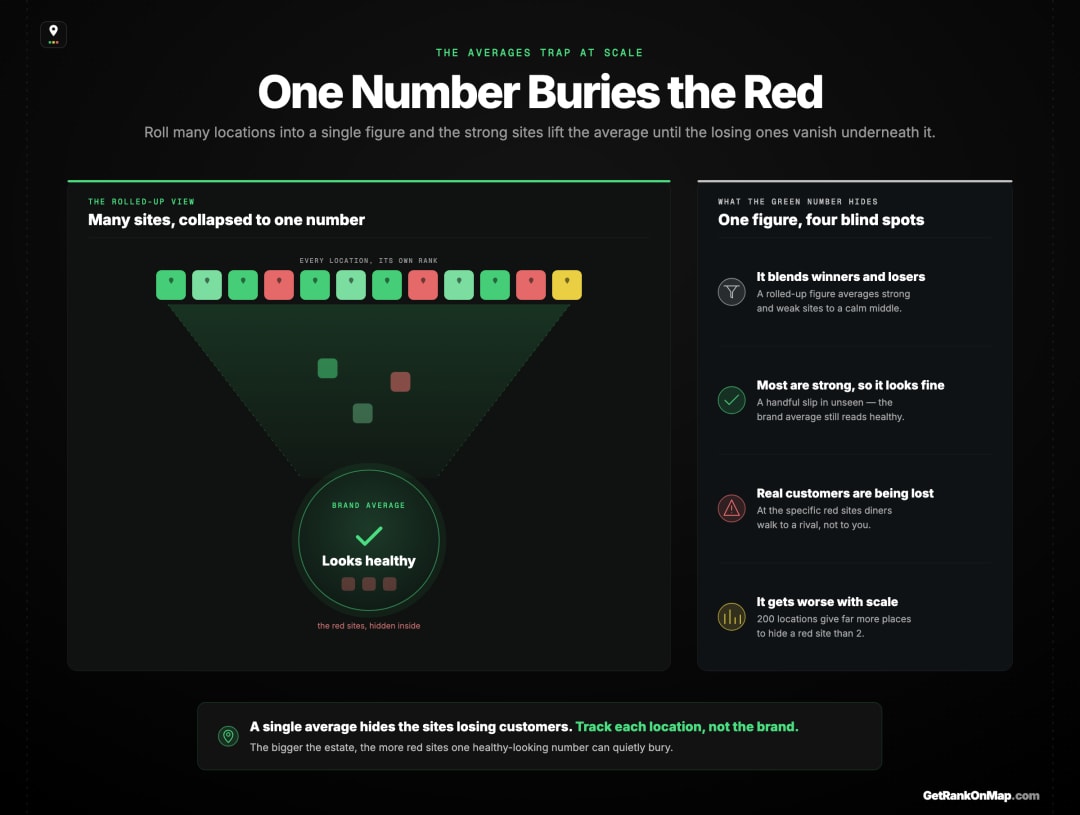
Roll many locations into a single brand-level figure and the maths betrays you: strong sites pull the average up and hide the weak ones underneath it. The group dashboard glows green while specific locations sit invisible in their own catchments. The bigger the estate, the more places there are for an underperforming site to hide inside a healthy-looking average.
Once you accept that each location is its own contest, the standard way of reporting multi-location performance starts to look dangerous. A single rolled-up number — average rank, total visibility, one headline figure for the brand — does exactly the wrong thing: it blends winners and losers into a reassuring middle.
Picture an estate where most locations are strong and a handful are quietly invisible in their own areas. Averaged together, the brand looks healthy, and the dashboard says so. But a single number is the least honest way to represent rankings that vary, and here it's hiding real lost customers — the specific sites where someone searching nearby never sees you, and walks into a competitor instead. Nobody at head office can see those sites, because the average has swallowed them.
This is the averages trap, and it gets worse with scale. Two locations are easy to keep an eye on individually. Two hundred are not, so the temptation to compress them into one figure grows exactly as the number of hiding places does. The businesses most exposed to this are the ones with the most to lose.
One Heatmap Per Location, Not One Number Per Brand
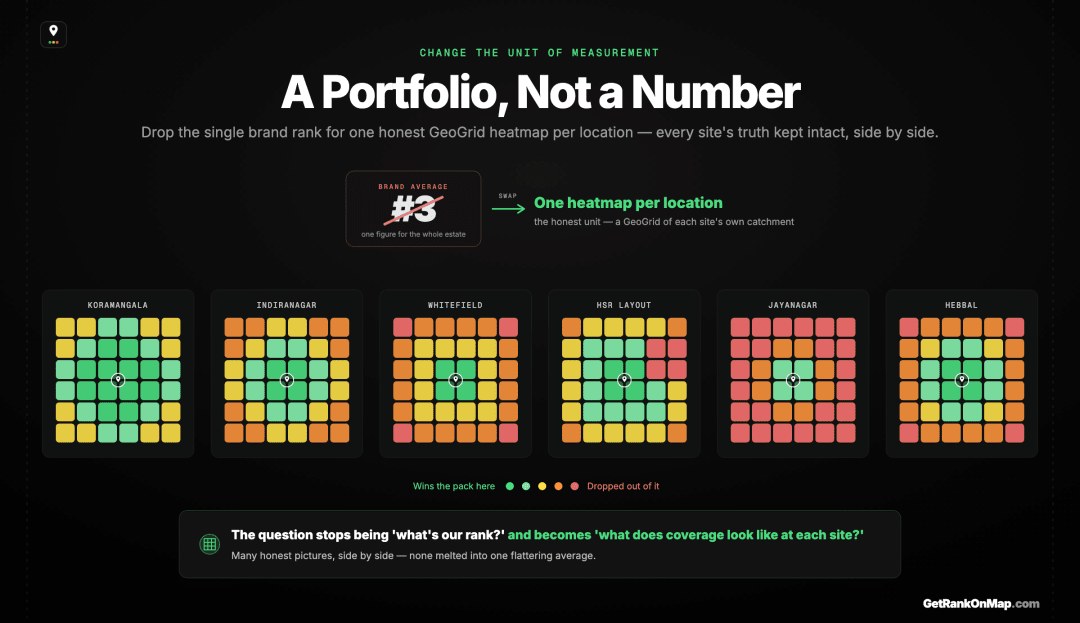
The honest unit of multi-location tracking is the individual location's coverage map — each site seen on its own ground, across its own catchment, the way its own customers search. Stacked into a portfolio, these per-location heatmaps preserve the truth that a brand-level number destroys: where, specifically, you're visible and where you're not.
If a single number lies, the fix is to change the unit of measurement. The honest unit isn't the brand — it's the location, seen as coverage across its own area.
For each site, that means a heatmap: its Map Pack rank checked across a grid of points in its catchment, drawn green where it's winning the pack and red where it's dropped out. Here's how a GeoGrid scan works. That's the truthful picture for one location — and the point at scale is that you keep that truth for every location rather than melting them all into one figure. A portfolio of per-site heatmaps is many honest pictures held side by side, each readable on its own terms.
This reframes the whole exercise. You're no longer asking "what's our rank?" — a question with no real answer across an estate. You're asking, for each location, "what does our coverage look like here?" — and keeping every answer intact. The brand view becomes a collection of truths, not an average that erases them.
The Real Job at Scale: Finding the Outliers
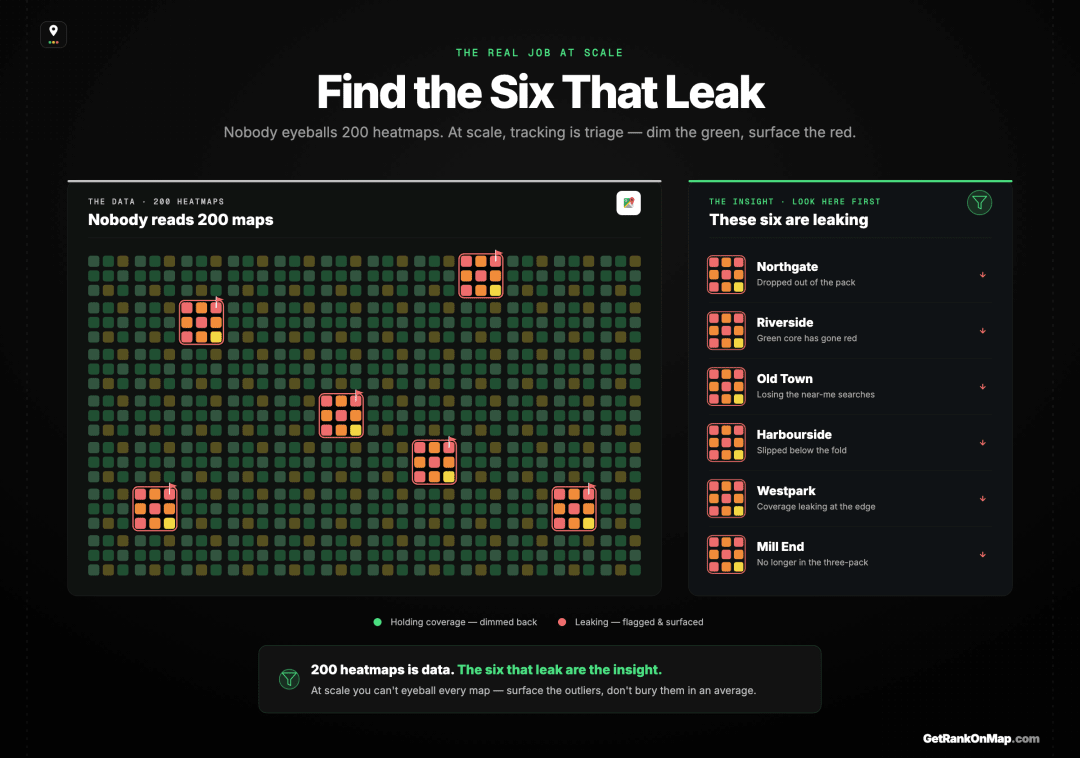
With dozens or hundreds of locations, you can't study every heatmap every day — nor should you. The job becomes triage: surfacing the handful of sites whose coverage has gone red while the rest stay green. The value of multi-location tracking isn't looking at everything; it's being pointed straight at the few places that are leaking.
Keeping a heatmap per location solves honesty, but it raises a practical question: nobody can eyeball two hundred maps. So at scale, tracking stops being about looking at everything and becomes about being shown what's wrong.
The real job is triage — finding the outliers. Across a large estate, most locations are usually fine, holding their coverage in their catchments. The money is in the exceptions: the few sites that have slipped into the red, lost ground to a new competitor, or never had coverage to begin with. Those are where customers are being lost right now, and those are what a multi-location view needs to surface — not bury under a brand-level average, and not hide in a stack of two hundred maps no one has time to read.
That's the difference between data and insight at scale. Data is two hundred heatmaps. Insight is "these six locations are leaking, look here first." The point of tracking the surface where local customers decide, across a whole estate, is to be pointed at the leaks before they cost you another month.
Tracking Coverage at Scale
So how should a multi-location business or an agency managing many sites actually track all this? Not with a brand-level number, and not by manually checking each location from a phone. You track coverage per location — a heatmap for every site in its own catchment — and you roll those into a portfolio that surfaces the outliers, so the weak sites can't hide behind the strong ones or behind a flattering average. Each location keeps its honest per-catchment picture; the estate-level view exists to point you at the red. That's how you hold the truth of every location and still act decisively across hundreds of them.
That's exactly what RankMap is built for: tracking Map Pack coverage location by location, and surfacing the sites that are leaking instead of drowning them in an average. RankMap isn't live yet — we're pre-launch. Join the waitlist for early access and be first in line the day the map is ready.
Change the Unit, Not the Dashboard
Multi-location local SEO isn't one big contest — it's many small ones, each anchored to a single address and a single neighbourhood of customers. That's why a brand-level rank number is a fiction: it averages winners and losers into a reassuring middle and hides the exact sites that are losing customers right now. The honest unit is the location, seen as coverage across its own catchment, with every site's truth kept intact rather than melted into one figure.
At scale, the job becomes triage — surfacing the few locations that are leaking before they cost you another month — instead of drowning in either a misleading average or hundreds of maps no one can read. That's the gap RankMap is built to close: per-location coverage that points you straight at the sites that need you. We're not live yet, but when we are, no underperforming location will be able to hide. Join the waitlist to be first in line.
Frequently asked questions
- 01Can I track my Google Maps ranking across multiple locations with one number?
- No — or rather, you can, but it lies. Because Google ranks each location from its own address against its own nearby competitors, every site has its own independent ranking in its own catchment. A single brand-level figure averages winners and losers together and hides the specific locations that are invisible in their own areas. The honest approach is one coverage map per location, rolled into a view that keeps each site's truth intact.
- 02Why do some of my locations rank well and others badly?
- Because each location competes in its own hyperlocal contest. Distance is measured from the searcher, so a site is judged in its own neighbourhood against whichever rivals sit nearby — a dense, crowded pack in one area and a sparser one in another. Brand strength helps, but every location still has to win its own local race, so it's normal for some sites to dominate their catchments while others quietly slip out of the pack in theirs.
- 03What's the averages trap in multi-location SEO?
- It's what happens when you roll many locations into a single performance figure: strong sites pull the average up and conceal the weak ones beneath it, so the brand looks healthy while specific locations are invisible in their own areas. The more locations you have, the more places there are for an underperforming site to hide inside a reassuring average — which is exactly why a single number becomes more misleading as you scale.
- 04How should an agency track many client locations efficiently?
- By tracking coverage per location and then triaging. Each site gets its own heatmap of where it's winning and losing the pack in its catchment, and the estate-level view exists to surface the outliers — the handful of locations that have slipped into the red — rather than forcing anyone to read hundreds of maps. The aim isn't to look at everything every day; it's to be pointed straight at the sites that are leaking, first.
- 05What does "hyperlocal" mean for rank tracking?
- Hyperlocal tracking means measuring visibility at the level of individual neighbourhoods around a specific location, rather than as a single city-wide or brand-wide figure. Because Map Pack ranking changes from one part of an area to the next, hyperlocal tracking samples rank across a grid of points in each location's catchment and shows it as a heatmap. For multi-location businesses, it means each site is read on its own ground, the way its own nearby customers actually search.
Explore with AI
Share this
Map your real rank across the city.
Free for the first 50 scans. No credit card.
Join the waitlist